In the first part of our mini-series on autoscaling, we looked at how autoscaling has evolved in OpenFaaS going all the way back to 2017, and how today you can use Requests Per Second, Capacity (inflight requests), and CPU utilization to scale functions horizontally.
Today, we are going to show you what you can do with custom Prometheus metrics, for when you need to scale based upon work being done by your function’s Pod, or some other metric that you emit to Prometheus like the number of pending requests, latency, or the number of items in a queue or event-stream.
Why do we need custom metrics?
Customers often ask: what is the right scaling approach for our functions? This presupposes that there is only one ideal, optimal way to scale every kind of workload you’ll ever have in your system.
Suppose you target 99.5% latency of requests. If you have a stateless function, which has no external dependencies, then a fair assumption would be that additional replicas would decrease latency during congestion. However if that function is dependent on a database, or a remote API, then adding new replicas may even increase, not decrease latency.
One approach such as RPS or Capacity may yield good results with many types of functions, but you cannot beat observing your functions in production, and tuning them according to your needs - whether that’s the type of scaling, the minimum/maximum replica count, or adding a readiness check.
Look out for how latency is affected during peak times, which HTTP status codes you receive, and don’t rule out invoking functions asynchronously, to defer and buffer the work.
To learn more about the built-in scaling options, see: Docs: Auto-scaling your functions
Overview - How scaling on custom metrics works
With the current design of the OpenFaaS Autoscaler, you need to do three things:
- Find an existing Prometheus metric, or emit a new one
- Configure the Recording Rules in the configuration OpenFaaS sets for Prometheus to emit a new scaling type
- Set that scaling type on your function using the
com.openfaas.scale.typelabel, just like with the built-in metrics
1. Pick a metric
You have five options for metrics:
- Use one of the built-in metrics from various OpenFaaS components ranging from the Gateway, to the queue-worker, to the Kafka connector, etc. These are documented here: Monitoring Functions
- Use the CPU or RAM metrics already scraped from each node in the cluster i.e.
pod_cpu_usage_seconds_totalorpod_memory_working_set_bytes - Use one of the built-in metrics emitted by the OpenFaaS watchdog - these include things like inflight requests, number of requests and latency
- Emit a new metric from your function’s handler. In this case, you’ll import the Prometheus SDK for your language of choice such as Python or Go, and register a metric endpoint, and add a couple of annotations so Prometheus knows to scrape it
- The final option is to have your own control plane emit a new metric centrally, this is where you may be able to expose a queue depth, the number of pending requests, or work with some kind of internal business metric like a Service Level Objective (SLO) or Key Performance Indicator (KPI)
2. Set up a new recording rule in Prometheus
The autoscaler uses a recording rule named job:function_current_load:sum to understand the total load for a given function. It then makes a simple calculation where the total sum is divided by the target figure for a function to determine the ideal amount of Pods.
Here is the rule we are using for CPU based scaling:
- record: job:function_current_load:sum
  expr: |
    ceil(sum(irate ( pod_cpu_usage_seconds_total{}[1m])*1000) by (function_name)
    *
    on (function_name) avg by (function_name) (gateway_service_target_load{scaling_type="cpu"}  > bool 1 ))
  labels:
    scaling_type: cpu
The expr field shows the Prometheus query that will be evaluated, and the labels show the scaling type for which the data will be emitted.
The first half ceil(sum(irate ( pod_cpu_usage_seconds_total{}[1m])*1000) by (function_name) is the basic query which resembles what you’ll see on kubectl top pod -n openfaas-fn.
The second half: * on (function_name) avg by (function_name) (gateway_service_target_load{scaling_type="cpu"} > bool 1 is an optimisation which means this rule is only evaluated when a function has a label set of com.openfaas.scaling.type: cpu.
You can set recording rules permanently by editing values.yaml, or insert them temporarily by running kubectl edit -n openfaas configmap/prometheus-config followed by kubectl rollout restart -n openfaas deploy/prometheus.
Bear in mind that if you’re port-forwarding Prometheus to your local machine, you will need to terminate the command and to run it again after the new version of the Pod is available.
3. Set the scaling type on your function
Here is a redacted example of how a function can target the cpu recording rule:
functions:
  bcrypt:
    labels:
    com.openfaas.scale.min: "1"
    com.openfaas.scale.max: "10"
    com.openfaas.scale.target: "500"
    com.openfaas.scale.proportion: "0.9"
    com.openfaas.scale.type: "cpu"
The minimum and maximum number of replicas are configured, followed by the target amount per Pod, in this case it’s “500Mi” or half a vCPU. The proportion is used to tune how close to the target the function should be before scaling. Finally, the com.openfaas.scale.type is set to cpu.
We’ll now look at some concrete examples of custom rules.
Example 1: Scaling on the request latency
In this example we’ll scale based upon the average request latency from the bcrypt function. The rough target we’ve seen is 6ms or 0.06s, so we’ll set that as a target, and if the latency goes up that figure, additional Pods will be added.
Here’s what we’ll put in our function’s configuration, we can omit com.openfaas.scale.min and com.openfaas.scale.max as they already have defaults.
functions:
  bcrypt:
    labels:
      com.openfaas.scale.target: "0.06"
      com.openfaas.scale.proportion: "0.9"
      com.openfaas.scale.type: "latency"
Next let’s add a recording rule, and use the latency from a metric emitted by the gateway:
  - record: job:function_current_load:sum
    expr: |
      sum by (function_name) (rate(gateway_functions_seconds_sum{}[30s])) / sum by (function_name)  (rate( gateway_functions_seconds_count{}[30s]))
      and
      on (function_name) avg by(function_name) (gateway_service_target_load{scaling_type="latency"}) > bool 1
    labels:
      scaling_type: latency
Contrasting latency with RPS
We adapted the e2e tests for the openfaas autoscaler to generate load on the bcrypt function using the ramp test which goes up to 150RPS over 2 minutes then sustains it for a further two minutes.
The results are from a single CPU, single node Kubernetes cluster with Pod vCPU limited to 1000Mi, or around 1x vCPU per Pod. With a maximum of 10 Pods, this is similar to 10 vCPUs generating bcrypt hashes at once.
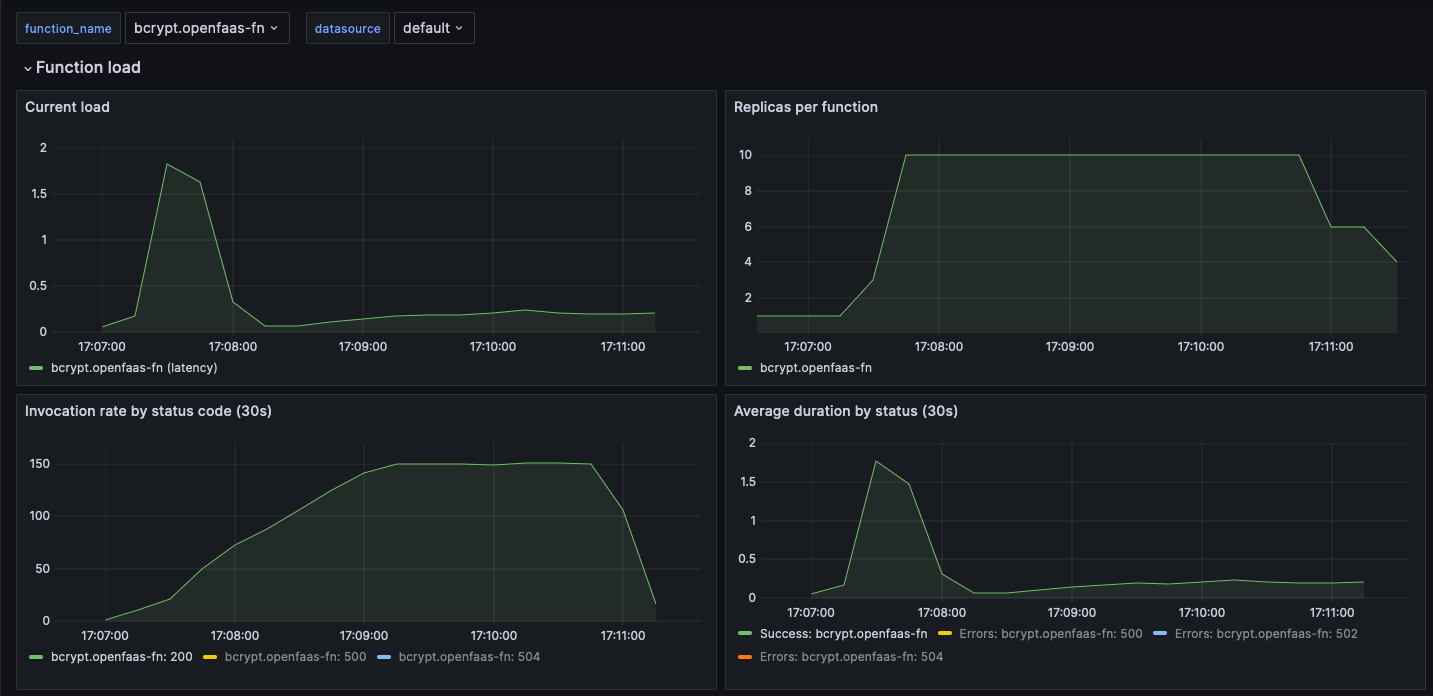
The initial latency starts off around the best case for this processor near 0.05-0.15ms per hash, then the thundering herd causes congestion. The system starts to add additional replicas, and the latency stabilises itself for the full test.
We also set up a stable scale down window of 2m30s in order to prevent any variable latency from causing the function to scale down too quickly.
We’d typically suggest something CPU-bound like bcrypt is scaled with the CPU approach, however we tried the same test with RPS, with a target of 10 RPS per pod.
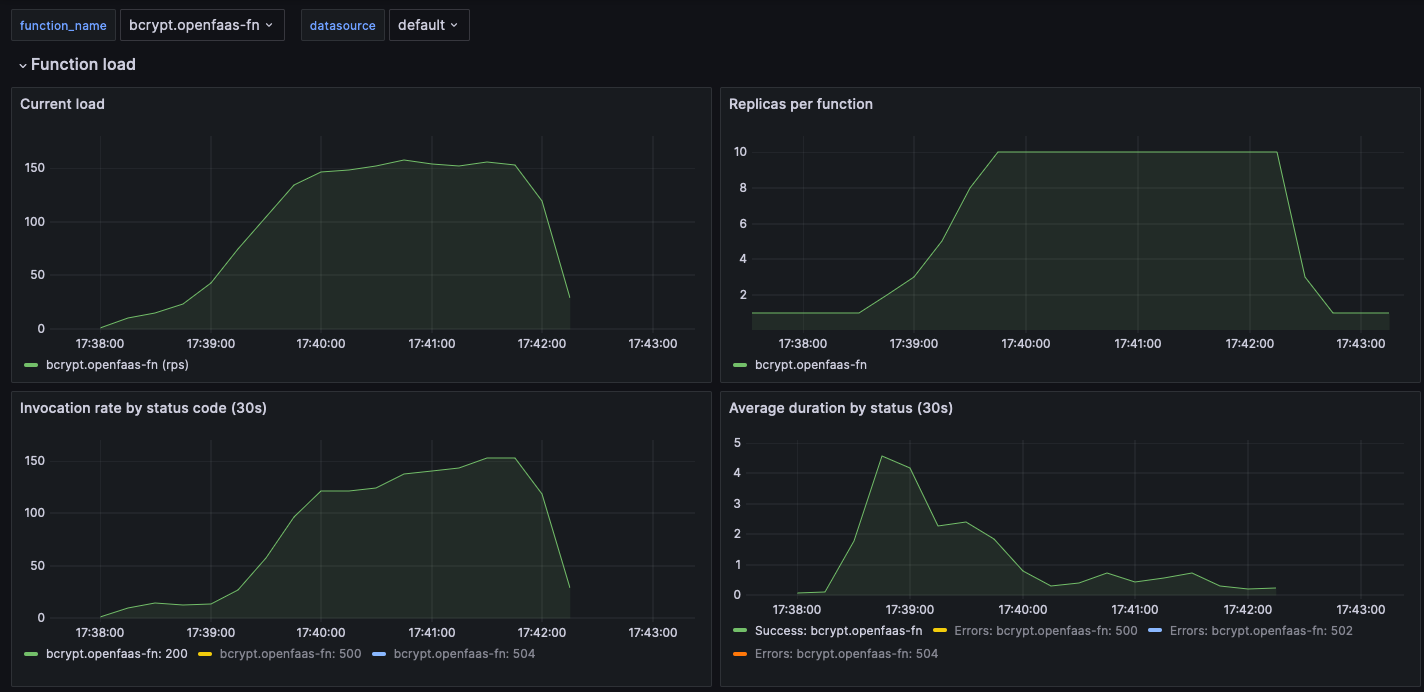
When you compare the two “Replicas per function” graphs, you can see that the custom latency based approach is more responsive and gives a more stable result in the “Average duration by status” graph.
Example 2: Scaling based upon a built-in watchdog metric
The watchdog itself emits several metrics which can be used for scaling, most of them are already available in aggregate from the gateway, but we wanted to show you this option.
Here’s how you can scale based upon the number of inflight requests:
  sleep:
    image: ghcr.io/openfaas/sleep:latest
    skip_build: true
    environment:
      write_timeout: 60s
    labels:
      com.openfaas.scale.min: 1
      com.openfaas.scale.max: 10
      com.openfaas.scale.target: 5
      com.openfaas.scale.type: inflight
    annotations:
      prometheus.io.scrape: true
      prometheus.io.path: "/metrics"
      prometheus.io.port: "8081"
In this case we’ve used the type of inflight, and added three extra annotations:
prometheus.io.scrape: true- this tells Prometheus to scrape the metrics from the Pod directlyprometheus.io.path: "/metrics"- this is the path where the metrics are exposedprometheus.io.port: "8081"- this is the port where the metrics are exposed, in this case it’s not actually the default of 8080, which is the proxy to access the function, but 8081, a separate HTTP server that only exposes Prometheus metrics.
For the recording rule:
  - record: job:function_current_load:sum
    expr: |
      ceil(sum by (function_name) ( max_over_time( http_requests_in_flight[45s:5s]))
      and
      on (function_name) avg by(function_name) (gateway_service_target_load{scaling_type="inflight"}) > bool 1)
    labels:
      scaling_type: inflight
This rule is very similar to the built-in capacity scaling mode, however the data is coming directly from function Pods instead of being measured at the gateway.
Example 3: Scaling on a metric emitted by the function
If you include the Prometheus SDK in your function, then you can emit metrics quite simply.
We’ve written an example for a Go function which scales based upon the number of items it receives in a JSON payload. You could imagine this may be a function connected to AWS SNS, which variable-sized batches are sent depending on congestion.
The below is a fictitious, but realistic example of the payload the function could receive from SNS:
{
    "items": [
        {
            "arn": "arn:aws:sns:us-east-1:123456789012:MyTopic",
            "event-type": "order_placed",
        }
    ]
}
Then this is how to import the Prometheus SDK, how to register the metric, and how to record the number of items against it for each request:
package function

import (
	"encoding/json"
	"fmt"
	"io"
	"net/http"
	"time"

	"github.com/prometheus/client_golang/prometheus"
	"github.com/prometheus/client_golang/prometheus/promauto"
	"github.com/prometheus/client_golang/prometheus/promhttp"
)

var (
	itemsGauge = promauto.NewGauge(prometheus.GaugeOpts{
		Name: "function_batch_items_processing",
		Help: "Total batch items currently being processed",
	})
)

var meticsHandler http.Handler = promhttp.Handler()

func Handle(w http.ResponseWriter, r *http.Request) {
	if r.URL.Path == "/metrics" {
		meticsHandler.ServeHTTP(w, r)
		return
	}

	if r.Body != nil {
		defer r.Body.Close()

		body, _ := io.ReadAll(r.Body)
		var payload map[string][]interface{}
		err := json.Unmarshal(body, &payload)
		if err != nil {
			http.Error(w, fmt.Sprintf("failed to unmarshal request body: %s", err), http.StatusBadRequest)
			return
		}

		items := payload["items"]
		numItems := len(items)

		itemsGauge.Add(float64(numItems))
		defer func() {
			itemsGauge.Sub(float64(numItems))
		}()

		// Simulate processing the items batch.
		time.Sleep(time.Millisecond * 100 * time.Duration(numItems))
	}

	w.WriteHeader(http.StatusOK)
}
Once again, specify your new scaling approach in the function’s configuration:
 sns-handler:
    lang: golang-middleware
    handler: ./sns-handler
    labels:
      com.openfaas.scale.target: 3
      com.openfaas.scale.type: batch-items
    annotations:
      prometheus.io.scrape: true
      prometheus.io.path: "/metrics"
Then you need a custom recording rule to sum up the total number of items in the metric across all the replicas:
- record: job:function_current_load:sum
  expr: |
    ceil(sum by (function_name) ( max_over_time( function_batch_items_processing[45s:5s]))
    and
    on (function_name) avg by(function_name) (gateway_service_target_load{scaling_type="batch-items"}) > bool 1)
  labels:
    scaling_type: batch-items
A basic way to invoke the function would be to use hey and a static batch size of i.e. 5 items.
cat > payload.json <<EOF
{
    "items": [
        {
            "arn": "arn:aws:sns:us-east-1:123456789012:MyTopic",
            "event-type": "order_placed",
        },
        {
            "arn": "arn:aws:sns:us-east-1:123456789012:MyTopic",
            "event-type": "order_placed",
        },
        {
            "arn": "arn:aws:sns:us-east-1:123456789012:MyTopic",
            "event-type": "order_placed",
        },
        {
            "arn": "arn:aws:sns:us-east-1:123456789012:MyTopic",
            "event-type": "order_placed",
        },
        {
            "arn": "arn:aws:sns:us-east-1:123456789012:MyTopic",
            "event-type": "order_placed",
        }
    ]
}
Then run the following command to invoke the function with that static payload.
hey -d '$(cat payload.json)' -m POST -c 1 -z 60s -q 1 http://127.0.0.1:8080/function/sns-handler
In this example, we assume the batches of events come from an external system, AWS SNS. It’s likely that we have no control over the batch size, or any way to emit a metric from the SNS service itself, so measuring in the function makes more sense.
If the data is coming from your own database, queue, or control-plane, then you could emit a centralised metric instead, from that single component.
Just bear in mind that if you emit the same data from multiple replicas of that component, you should apply an avg function instead of a sum in the recording rule, otherwise the total will be multiplied by the number of replicas. This is something we’ve already factored into the built-in metrics for RPS and Capacity, which are emitted from the gateway, which often has multiple replicas.
Example 4: Scaling based upon an external metric
We’ll show you how you could set up scale based upon RAM for OpenFaaS functions, just like the built-in CPU scaling type.
There is a function we’ve packaged that uses a set amount of RAM, which can be used to simulate RAM usage.
  stress-memory:
    skip_build: true
    image: ghcr.io/welteki/stress:latest
    fprocess: "stress --vm 1 --vm-bytes 20M -t 10"
    requests:
      memory: 20Mi
    environment:
      read_timeout: "2m"
      write_timeout: "2m"
      exec_timeout: "2m"
    labels:
      com.openfaas.scale.min: 1
      com.openfaas.scale.max: 10
      com.openfaas.scale.target: 20000000
      com.openfaas.scale.type: memory
      com.openfaas.scale.target-proportion: 0.8
Let’s look at the labels:
com.openfaas.scale.target- this is the target amount of memory in bytes i.e. 20MBcom.openfaas.scale.target-proportion- this is the proportion of the target that the function should be at before scaling, in this case 80%com.openfaas.scale.type- this is set tomemory
Now let’s write the recording rule:
  - record: job:function_current_load:sum
    expr: |
      ceil(sum by (function_name) (max_over_time(pod_memory_working_set_bytes[45s:5s]))
      *
      on (function_name) avg by (function_name) (gateway_service_target_load{scaling_type="memory"} > bool 1))
    labels:
      scaling_type: memory
This rule is very similar to the CPU based rule, but it uses the pod_memory_working_set_bytes metric instead which is already scraped by Prometheus from each Node in the cluster.
In-conclusion
Over this two-part series, we started off with a recap of the autoscaling journey, how it’s evolved to meet new customer needs, and then went on to show practical examples on how to extend it to meet your own bespoke needs.
We expect that most customers will get the best results from the built-in scaling modes such as: RPS, Capacity and CPU. However if your workload or its invocation patterns are unique, then the custom metrics are a powerful option for fine-tuning function scaling.
In part one we also introduced the stable window for scaling down, which can be combined with the built-in or custom scaling types to slow down the responsiveness of the autoscaler.
OpenFaaS customers can reach out to us at any time via email for help and advice on autoscaling and general configuration of the platform. We also have a weekly call that is free to attend, where you’ll get to speak to other customers, share experiences, suggest improvements, and ask questions.
See also:

Alex Ellis
Founder of @openfaas.